Difference between revisions of "DATE Africa Regional Infrastructure"
Allen.brian (talk | contribs) m (→Construction Patterns) (Tag: Visual edit) |
Allen.brian (talk | contribs) m |
||
| Line 406: | Line 406: | ||
| | | | ||
|} | |} | ||
| + | |||
| + | ==Transportation Architecture== | ||
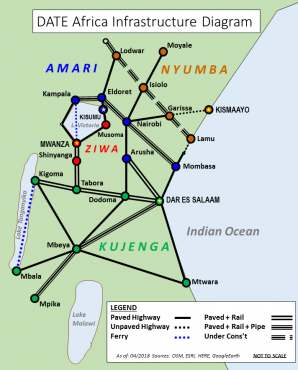
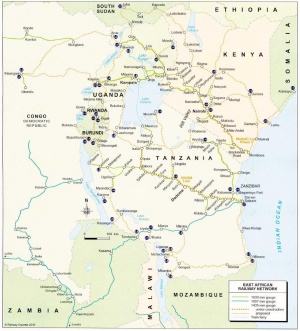
[[File:Africa Infrastructure Schematicv2.png|thumb|370x370px|Regional Infrastructure Diagram]] | [[File:Africa Infrastructure Schematicv2.png|thumb|370x370px|Regional Infrastructure Diagram]] | ||
| − | |||
Transportation networks historically connected interior resources and major population centers with the nearest port city. New projects focus on connecting population centers. Transportation development accounts for most current African infrastructure investment. International construction practices are replacing diverse standards of the colonial era. | Transportation networks historically connected interior resources and major population centers with the nearest port city. New projects focus on connecting population centers. Transportation development accounts for most current African infrastructure investment. International construction practices are replacing diverse standards of the colonial era. | ||
===Roads=== | ===Roads=== | ||
Revision as of 19:46, 23 April 2018
DATE Africa > DATE Africa Regional Infrastructure ←You are here
African infrastructure is expensive. Long distances, low population densities, uneven management, and intraregional competition contribute to these costs. African infrastructure projects emphasize expensive rehabilitation over basic maintenance. The World Bank estimates that about 30 percent of Africa’s infrastructure requires rehabilitation – even more in rural and conflict-prone areas.
Despite the cost, both domestic and international players are keen to expand Africa’s infrastructure. States control most infrastructure systems, but public-private partnerships (PPP) are increasingly more common. The World Bank and international development finance institutions provide most of the financing, followed by domestic government financing. Olvana is the largest financier and constructor of African infrastructure.
The typical project involves a consortium of non-African state development agencies, international government organizations, private financiers, and construction companies. Following the financing announcement, spending or progress is hard to trace until the project is complete. A large portion of the announced projects are either scaled back or never completed. In some cases, competing projects do not have the demand to justify the large investments.
Developed infrastructure correlates with population density. Amari’s main cities: Nairobi, Kampala and Mombasa, are key nodes of the 800-mile Northern Victoria Corridor, a road, rail, and pipeline network. Kujenga follows Amari in both population and infrastructure development, with the competing Dar Es Salaam - Kigoma, DARGOMA, Corridor linking the Indian Ocean port of Dar Es Salaam with Lake Tanganyika and Ziwa’s capital, Mwanza, on the southern shore of Lake Victoria. A major north-south transportation artery runs through Moyale in Nyumba, crossing into Amari just south of Isiolo, through Nairobi to Mbeya, Kujenga in the south. Nyumba, Amari, and Kujenga all compete to be the Indian Ocean gateway of choice to landlocked countries.
Lastly, proposed infrastructure projects are increasingly gathering strong opposition through both standard and social media, quickly gathering international support. The more disruptive to the environment, the more opposition they garner. Examples include port expansion and coal power plant construction in Lamu, Nyumba, and transportation corridors bisecting wildlife ranges in all four countries. While opposition campaigns often start on social media sites and increasingly evolve to on-site demonstrations.
Contents
Construction Patterns
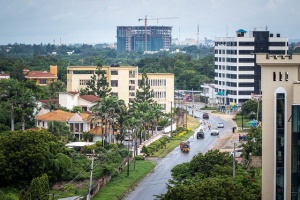
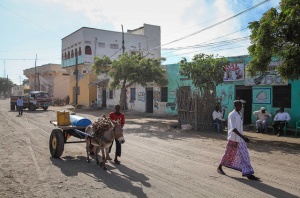
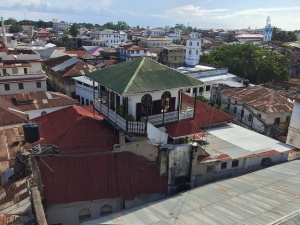
Most urban construction is early twentieth century or newer, following Western European colonial styles and building methods. Rural and coastal urban construction ranges from dense random to shantytown. DATE infrastructure descriptions divide shantytown into two categories: 1) organized, semi-permanent dwellings, and 2) informal settlements or slums. Amari has the highest proportion of modern urban, closed-block construction in the region, followed by Ziwa, Kujenga, and Nyumba respectively. However, measured by area, most urban construction type in the region is shantytown.
Major Cities. Nairobi, Dar Es Salaam, and Kampala stand out as having the highest proportion of urban modern closed-block construction in the region. They each have modern concrete high-rise central business districts, high-rise residence clusters, and modern amenities. They also share the overall regional problems of inadequate utility connection, and large areas of dense, low-rise, informal settlements.
Other Cities. Cities like Kismaayo, Mombasa, Mbeya, Mwanza, Arusha, and Kisumu share some of the characteristics of the major urban centers but have less of an urban core, both in size and density. They also include significant residential belts beyond the dense, low-rise, organized shantytowns that are significant contributors to the urban food supply and informal economy.
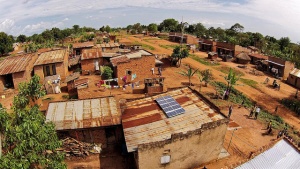
Rural Settlements. Regional rural settlements are mostly low density, randomly constructed villages, or building clusters. Most residences will have corrugated metal or grass roofing, mud or wood walls and earthen flooring. Public buildings may have concrete flooring.
| Amari | Kujenga | Ziwa | Nyumba | |
|---|---|---|---|---|
| Roofing | ||||
| Corrugated Iron Sheets/Tin | 73 | 61 | 80 | 16 |
| Grass/Palm Thatch | 17 | 34 | 61 | 80 |
| Concrete | 4 | - | - | - |
| Asbestos Sheets | 2 | - | 2 | 1 |
| Tiles | 2 | - | - | - |
| Mud/Dung/Other | 2 | 5 | 2 | 3 |
| Wall | ||||
| Mud/Wood | 37 | 26 | 63 | 18 |
| Brick/Block | 17 | 18 | 17 | 7 |
| Stone | 17 | 19 | 2 | 3 |
| Wood Only | 11 | 25 | 2 | 6 |
| Mud/Cement | 8 | 3 | 13 | 4 |
| Corrugated Iron Sheets/Tin | 7 | 1 | 2 | 3 |
| Grass/Reeds | 3 | 8 | 1 | 60 |
| Floor | ||||
| Cement | 41 | 38 | 28 | 12 |
| Tiles | 2 | - | - | - |
| Wood/Other | 1 | 1 | 2 | 10 |
| Earth | 56 | 61 | 70 | 78 |
Population Density and Urban Zones
| Amari | Kujenga | Ziwa | Nyumba | |
|---|---|---|---|---|
| Total Pop. 2017 | 76,520,462 | 12,863,687 | ||
| Pop. Density /km2 | 66 | |||
| Annual Growth Rate | 3.2 % | |||
| Pct. Urban Pop. | 27 % | |||
| Urban Growth Rate | 3.8 % |
Utilities Overview
African infrastructure development increasingly lags behind the rest of the world. In 1970, sub-Saharan Africa generated three times the electricity of South Asia. By 2000, South Asia had twice the generating capacity of sub-Saharan Africa. Transportation and water sectors exhibit similar trends. The region suffers from uneven electricity, water, and sanitation distribution. While cities enjoy higher utility connection rates, shantytown and rural areas remain largely disconnected. Even in those areas with utilities, only a fraction of the population has connections.
| Country | Lighting (Elect) | Cooking (Gas,Elect) | Cooking (Wood, Charcoal) | Water (Piped) | Water (Well, Spg) | Sanit (Swg) | Sanit (Ltrne) |
|---|---|---|---|---|---|---|---|
| Amari | 22/51/7 | 4/9/1 | 93/86/97 | 23/39/14 | 35/24/43 | 8/21/1 | 80/76/78 |
| Ziwa | |||||||
| Kujenga | |||||||
| Nyumba |
Electricity Generation and Transmission
The region is the least-served in the world but with developing generation and transmission capabilities. Tin lamps or lanterns are the main lighting sources. Many businesses and households rely on diesel generators due to frequent outages.A concerning characteristic of African hydroelectric power infrastructure is rapid sedimentation which reduces generating capacity. Coupled with inadequate maintenance, projected power outputs may not deliver as advertised.
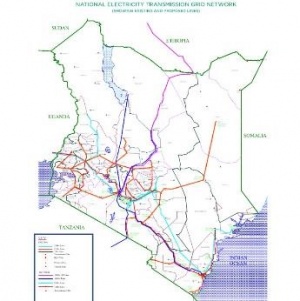
Regional states share power through the East Africa Electricity Pool. As each country expands their electrical grid, major Amari-Nyumba and Amari-Kujenga power interchanges are under construction. These should stabilize electricity availability and reduce outages.
Communities off the main grid traditionally rely on medium speed diesel generators for power via short ranges mini-grids. New wind and solar power plants make up a growing component of the regions generation capacity, especially in northeast Amari, Nyumba and north-central Kujenga.
| Country | Overall Generating Cap.(GWh) | Overall Power Use (GWh) | Elect. Rate Pct. | Out’g Rate % | Emergency Generation Pct. | Hydro/Geo Therm Gen. Pct. | Natural Gas Gen. Pct. | Coal Gen. Pct. | Oil Gen Pct. |
|---|---|---|---|---|---|---|---|---|---|
| Amari | 9,000 | 8,500 | 20/60 | 8 | 8 | 36/44 | 0 | 0 | 19 |
| Ziwa | PC Tanz | 6.5 | 20 | ||||||
| Kujenga | 6,000 | 6,100 | 24/71 | 6.5 | 20 | 36 | 32 | 0 | 29 |
| Nyumba | unk | unk | unk | unk | unk |
Cooking Fuel
Despite abundant natural gas and hydroelectric resources, wood and charcoal are the predominant cooking fuels.
Water
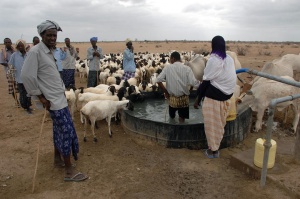
The majority of the region drains into Lake Victoria, which in turn drains into the Nile. Lake Victoria is the world’s largest tropical freshwater lake. The majority of the remainder drains to the Indian Ocean via the Tana River, bordering Nyumba. Amari, Nyumba and Ziwa are also members of the Nile Basin Initiative, an intergovernmental organization chartered to address access, irrigation, hydroelectric power, and environmental issues related to the Nile. The international agreement severely restricts upstream irrigation and hydroelectric projects, which must be approved by the downstream members.Unfortunately, less than a quarter of the population has access to household piped water, with the majority relying on standposts, wells, or boreholes. Increasing urbanization rates are dropping the proportion of city residents with access to piped water networks. In rural communities, over forty percent rely on lakes or streams for water.
Most agriculture relies on rain, with less than four percent of the potential acreage under irrigation.| Water Supply | Amari | Kujenga | Nyumba | Ziwa |
|---|---|---|---|---|
| Piped Household | 6/14/2 | |||
| Piped Other (Standpipe) | 20/38/11 | |||
| Spring/Well/Borehold | 41/27/48 | |||
| Surface(Lake/River/Stream) | 28/12/36 | |||
| Vendor | 4/8/1 |
Sanitation
For most of the region’s population, sanitation equates to latrines and not piped wastewater systems. Traditional and improved latrines are the most prevalent sanitation method. While major cities can claim 50 percent connection rates, the average city sewer reaches less than twenty percent of its population. In some rural districts, less than forty percent of the population can access improved sanitation.
| Country | Sewer (Urb) | Sewer (Ru) | Latrine (Urb) | Latrine (Ru) | Other (Urb) | Other (Ru) |
|---|---|---|---|---|---|---|
| Amari | 18 | 6 | 81 | 73 | 1 | 21 |
| Ziwa | ||||||
| Kujenga | ||||||
| Nyumba |
Transportation Architecture
Transportation networks historically connected interior resources and major population centers with the nearest port city. New projects focus on connecting population centers. Transportation development accounts for most current African infrastructure investment. International construction practices are replacing diverse standards of the colonial era.
Roads
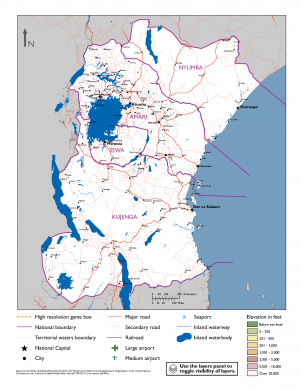
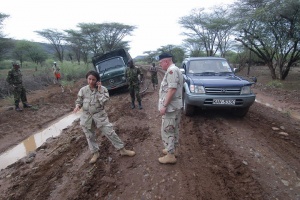
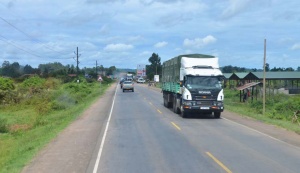
Though there have been many attempts to establish an intercontinental road network, regional road systems are only loosely coordinated. Most primary roads connecting the region’s main cities are paved and in good repair. Primary roads connecting second-tier cities and secondary roads are mostly unpaved gravel or murram, and difficult to travel during the monsoon seasons.Traffic is relatively sparse, mostly commercial. Overloaded trucks are the main cause of road damage. Because of this, there is a growing emphasis to shift heavy freight to either rail or pipelines, though motor freight remains the most dependable, economical, and quickest transportation method.
Weighbridges and border crossings are major choke points. One-stop border crossings are gradually replacing traditional entry and departure crossings. Regional road travel is dangerous. Vehicle related incidents are a leading cause of death.Bus Transport
Nairobi, Kampala, and Dar Es Salaam have large bus fleets serving local populations, similar to those found in other large cities in the developing world. Municipalities control these services.
Privately owned long-haul motor coach and minibus services provide inter-urban and international bus transport from the major cities. Service and prices vary, but they provide a relatively dependable and less expensive alternative to air transport.
| Departure | Arrival | Dur (Hrs) |
|---|---|---|
| Mombasa | Dar Es Salaam | 5-8 |
| Mombasa | Lamu | 9 |
| Mombasa | Tanga | 4 |
| Mombasa | Nairobi | 8 |
| Nairobi | Dar Es Salaam | 13 |
| Nairobi | Arusha | 5 |
| Nairobi | Kampala | 12 |
| Nairobi | Lamu | 7 |
| Nairobi | Garissa | 6 |
| Dar Es Salaam | Kampala | 25 |
| Kampala | Bukoba | 7 |
| Kampala | Mwanza | 12 |
| Dar Es Salaam | Mwanza | 16 |
| Dar Es Salaam | Arusha | 7 |
Rail
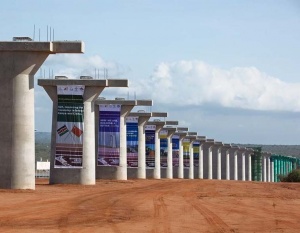
Regional rail use is limited. Rail transport is extremely capital-intensive and depends on freight traffic to justify the expense. Passenger transportation is heavily subsidized. While rail gauges vary, 1435mm, standard gauge rail (SGR) runs from Mombasa to Nairobi and will replace the 1,000mm track running the rest of the Northern Transport Corridor. 1435mm is also the standard for all planned rail projects throughout the region. While varied track gauge may contribute to the local/regional focus of the rail systems, it is not the critical factor. The physical routing of the networks creates built-in isolation and in many cases competition.
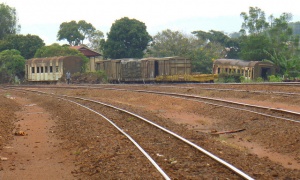
To date, for all of the fanfare surrounding new rail development, the system has not delivered on the promises of developing economy, carrying less than 10 percent of the region’s freight. Rail traffic density is light, similar to a light branch line in a developed economy. All rail is single-line with limited sidings. Vandalism and track theft contributes to the system’s unreliability.
Diesel-electric locomotives are the prime movers. These are mostly Olvanese units or second-hand U.S. engines. The poor condition of the rolling stock and track restricts speed and axle loads.
| Gauge | 1,435 mm "Standard Gauge Rail" (SGR) |
| Track and Formation Design | U.S. Standards |
| Signaling and Train Control | European Standards |
| Max. Axle Load | 25 metric tons (77% of capacity) |
| Maximum Train Length | 2,000 km |
| Design Speed, Freight | 80 km/hr |
| Design Speed, Passenger | 100 km/hr |
Aviation
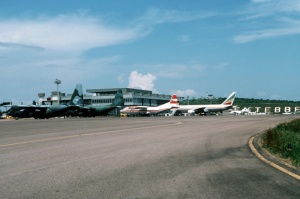
Vast distances, landlocked countries, and lack of an adequate road network make air travel essential in the region. Facilities and aircraft are sufficient to service the demand. While only Amari has a state-run intercontinental airline, Amari, Kujenga and Ziwa have regional carriers.
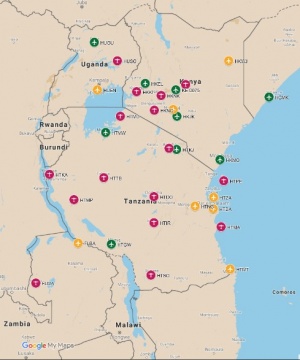
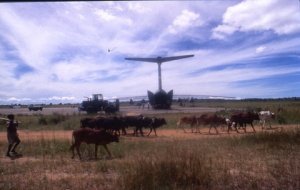
The region has over sixty airfields with paved runways and over 500 unpaved airstrips of varying quality. Many of the remote airstrips are unusable because of poor maintenance or repurposing by local inhabitants. The Cessna 208 Caravan is the primary aircraft used by charter and regional carriers to service the smaller fields; however, a few continental cargo carriers operate 70’s era jetliners delivering fuel and heavy freight to remote industrial sites.
All regional states have nationalized airport authorities. The regional aviation accident rate is 65 percent higher than the world average. Amari, Kujenga, and Ziwa are improving safety practices, having installed modern air traffic control systems. Most airports have an International Civil Aviation Organization (ICAO) designation, but this does not necessarily equate to paved runways and terminal control.
Amari and Kujenga are the regional leaders in aviation infrastructure. In addition to airfreight, significant passenger traffic flows through Nairobi to safari and ecotourism destinations in Amari, Kujenga, and Ziwa. All three countries have a stake in maintaining international cooperation and security.
Maritime
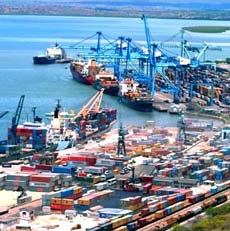
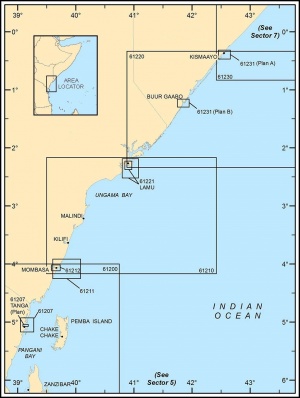
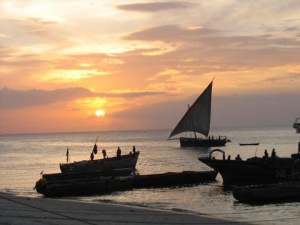
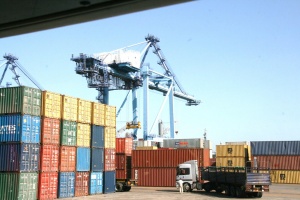
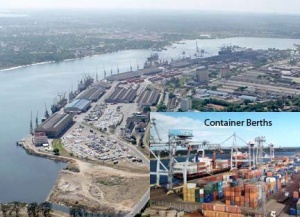
Both Amari and Kujenga have medium sized deep-water ports on the Indian Ocean and compete to service their landlocked neighbors. These ports serve feeder ships connecting with major shipping hubs of Dubai and Djibouti. Kujenga’s rail system connects Dar Es Salaam to both Lakes Tanganyika and Victoria, while Amari’s rail serves the northern ports on Lake Victoria and also its western and northern landlocked neighbors. Nyumba’s port of Kismayo lacks is much smaller and lacks road, rail and pipeline service; further limiting its utility. Comprehensive port data is available via the NGA Pub 150, World Port Index[1]. Detailed descriptions of both Mombasa and Dar Es Salaam are in NGA Pub 171, Sailing Directions.[2]
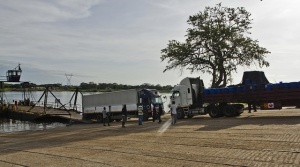
All three Indian Ocean countries have significant fishing and modest coastal freighter fleets. The UN cited Kujenga as providing a “flag of convenience” registry to global shipowners. Ziwa’s limited maritime assets are the Lake Victoria ports of Mwanza and Musoma, and a majority stake in the Lake Victoria rail ferry serving Amari and Kujengan ports. The Great Lakes ports have no shipbuilding capability. Ships are delivered in pieces and reassembled on the lake.
The three main rivers, Upper White Nile, Tana, and Ruvuma have seasonal flows and only small fishing and passenger traffic with negligible commerce.| WPI | Name | Max Dr.
(m) |
Max Ln.
(m) |
Crane
(mt) |
Tot.
Berth |
RO/
RO |
Cont. | Bulk | Tank |
|---|---|---|---|---|---|---|---|---|---|
| 47130 | Kismaayo, NYU | 8.5/8 | 150+ | x | 4 | - | - | - | - |
| 47110 | Lamu, NYU | 4.9/4.9 | 200 | x | - | - | - | - | - |
| 47090 | Malindi, AMA | 11 | 150 | x | - | - | - | - | - |
| 47105 | Kilifi, AMA | 14/9 | 150 | x | - | - | - | - | - |
| 47100 | Mombasa, AMA | 15/14 | 350 | 25+ | 19 | 1 | 6+ | 1 | 3 |
| 47020 | Chake, AMA | 12.5 | 150 | x | - | - | - | - | - |
| 47050 | Zanzibar, KUJ | 12.5/4.9 | 150/110 | <24 | 2 | - | - | - | - |
| 47030 | Tanga, KUJ | 17/4.9 | 150 | x | 1 | L | - | - | L |
| 47010 | Dar Es Salaam, KUJ | 10.5 | 183 | +100 | 14 | 7** | 4 | 7** | 3 |
| 46975 | Mtwara, KUJ | 4.9/9.4 | 150+ | 25+ | 2 | - | - | - | 1 |
Legend - WPI: World Port Index Number, Max Draft: Anchor/Pier, L: Lighterage. ** RoRo/General/Bulk
| Name | Lake | Max Drft (m) | Max Lgth(m) | Crane (Tns) | Tot. # Berths |
| Kisumu, AMA | VIC | 8.5/8 | |||
| Port Bell/Kampala, AMA | VIC | 4.9/4.9 | |||
| Bukoba, KUJ | VIC | 11 | |||
| Mwanza, ZWA | VIC | 14/9 | |||
| Musoma, ZWA | VIC | 15/14 | |||
| Nansio, ZWA | VIC | 12.5 | |||
| Kigoma, KUJ | TKA | 12.5/4.9 | |||
| Tanga, KUJ | TKA | 17/4.9 | |||
| Mpulungu, KUG | TKA | 10.5 |
Regional Petroleum Pipeline and Storage
Similar to the region’s mineral endowment, southeast Africa and in the Gulf of Guinea has most of the continent’s oil and gas reserves. However, Lake Albert and Lake Turkana both have proven crude oil reserves. Kujenga has most of the region’s natural gas, although both Amari and Nyumba have large Indian Ocean exploration activities underway. Ironically, the region suffers from diesel, illuminating kerosene, and cooking fuel shortages. Only Amari and Kujenga have petroleum pipelines.
Pollution
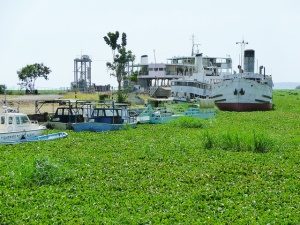
Population growth in the Lake Victoria area threatens the water quality of the lake and downstream on the Victoria Nile and Albert Nile. The largest contributors are raw sewage, solid waste, and chemical run-off. Additionally, the northern lake ports suffer from extensive algae and vegetation blooms.
Lack of government regulation on tailpipe and industrial emissions create a growing air pollution problem in the cities. Local civic groups are also mobilizing against the planned increase in coal burning power plants, perceived as second-hand units installed under the auspices of foreign aid. City water pollution is proportional to lack of wastewater management. Areas with large informal settlements suffer the most as the effluent enters the watershed.
| DATE Africa Quick Links . | |
|---|---|
| Amari | Political • Military • Economic • Social • Information • Infrastructure • Physical Environment • Time |
| Kujenga | Political • Military • Economic • Social • Information • Infrastructure • Physical Environment • Time |
| Nyumba | Political • Military • Economic • Social • Information • Infrastructure • Physical Environment • Time |
| Ziwa | Political • Military • Economic • Social • Information • Infrastructure • Physical Environment • Time |
| Other | Non-State Threat Actors and Conditions • Criminal Activity • DATE Map References • Using The DATE |
